Network Monitoring, Observability and Analytics are three terms commonly heard in network operations. While all three use network data to manage the network, their purpose and implementation is different.
Network monitoring has been the backbone of network operations, where data is monitored using disparate tool sets and alerts are set up using static rules and thresholds.
Network observability is a characteristic of the system. Observability depends on the data that is available to understand the inner workings of the network. It also involves the ability to correlate the multiple data sources to provide a unified view in real time.
Network analytics is about looking at historical network data (traffic data, logs, metrics, events, or alarms) collected over a period of time and using descriptive statistics, visualizations, event correlations, statistical and machine learning models to derive insights from the data.
While monitoring and observability is about managing the day-to-day operations, analytics is about looking ahead. In this post, we will look at different types of Network Analytics and how they can be used in network operations.
Network Analytics help enterprises and service providers answer key questions about networks, services and security threats.
- Is this network link overloaded and about to fail?
- Are we seeing any unusual scanning activity in the network?
- Is the application response time getting better or worse?
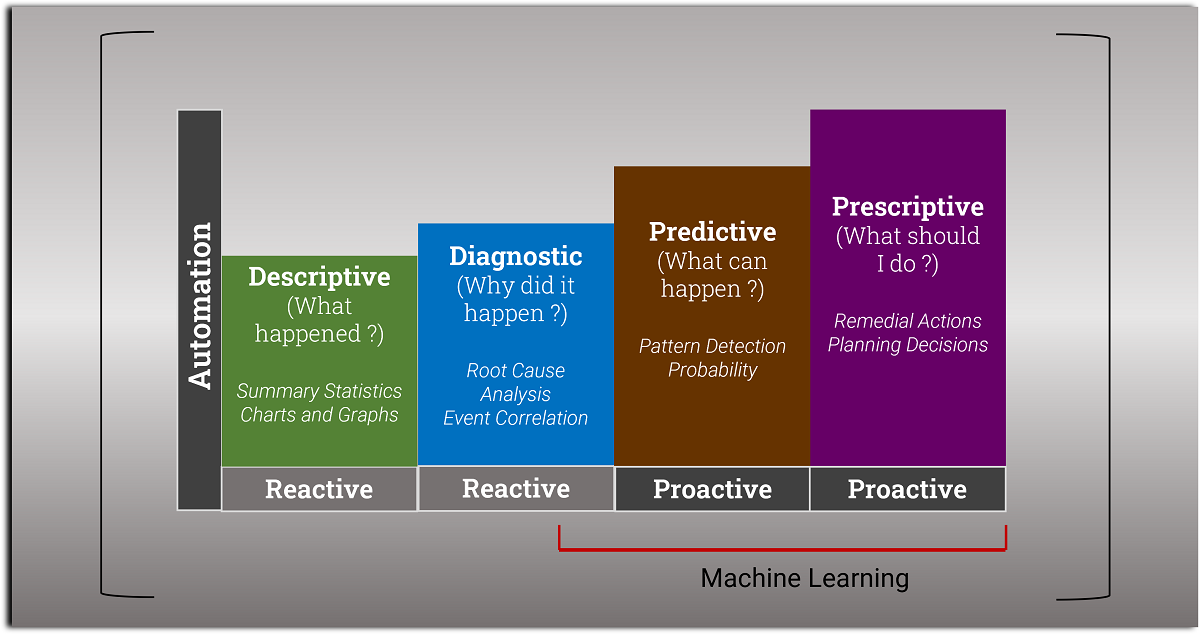
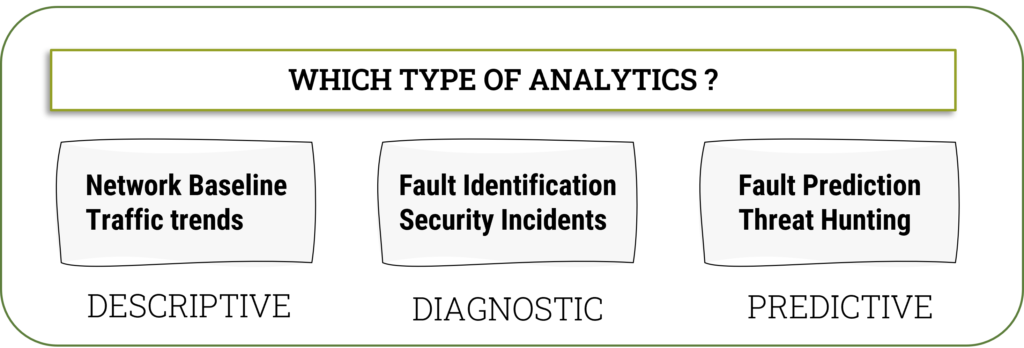
Types of Network Analytics
Descriptive analytics provides summary statistics and visualizations using charts and graphs to describe what happened. While tools can provide reports summarizing and visualizing the data, network engineers have to manually analyze the data to find trends and anomalies.
An example would be the average number of bytes per IP address for a 30 day period. It can be summarized in different time windows (1 minute, 1 hour, 1 day). This will provide baselines at different granularity.
Diagnostic analytics is about troubleshooting network problems and finding their root causes. While certain monitoring tools might automatically correlate the data to provide context, network engineers have to correlate the events and alerts from various tools to diagnose the problem.
An example would be correlating a drop in performance on one host with traffic spikes from a different host to the same server.
Predictive analytics uses statistical modeling and machine learning to learn patterns from historical data and predict the probability of various outcomes. This would help engineers move from reactively understanding the data to diagnose problems to proactively investigating to address the issue.
An example would be predicting the probability of link failure based on past traffic volume and other traffic behavior (packet drops, retransmissions etc.)
Prescriptive analytics proposes remedial actions for network failures or potential security threats. This can be used by network engineers for decision support or full automation.
An example would be prescribing a set of actions to fix a network link degradation – QoS provisioning, rerouting, adding bandwidth etc.
This approach is still very much in its infancy, so we will address it in future blog posts as the landscape becomes clearer.
How can Network Analytics help with your operations?
The goal of Network Analytics is twofold – moving from reactive to proactive and from manual to automated. In most cases, a combination of the different types of analytics must be implemented incrementally to obtain operational efficiencies with minimum disruption to current tools and processes.
If you are using traditional network monitoring tools (open source or commercial), you can collect data for a period (e.g., 30 days).
You can then use descriptive analytics to do the following:
- Create a network baseline. Depending on the type of monitoring tools you have, you can collect – traffic data, events (from logs), or device metrics (CPU usage, memory, queue drops) to create baselines.
- Refine thresholds based on actual trends.
By understanding trends and baselines, you can now use diagnostic analytics to do the following:
- Perform data correlation. An example would be a time-based correlation where you can correlate events that happened within the same time window.
- Extract relevant data that would contribute to the diagnostics (for e.g. TCP retransmission percentage)
When you have a network baseline and data driven diagnostic analytics in place, you can then move to a more proactive mode by predicting what is likely to occur in the future. Using the historical data collected, you can build statistical or machine learning models to do the following:
- Predict the traffic usage and trends
- Predict network failures
- Detect and predict anomalies
By implementing data driven analytics as part of your operations, you can understand your network and the core issues causing disruptions. This can then be used to proactively engineer solutions that remove those issues from your environment.