In Part 1 of this two part blog series, we defined what network anomalies are, identified their causes and classified them using various criteria.
In this post, we will look at the following:
- Different methods for detecting network anomalies using network traffic.
- Challenges inherent in network anomaly detection.
- Applications of anomaly detection in network and security operations.
- Implementation of anomaly detection methods in common network and security products
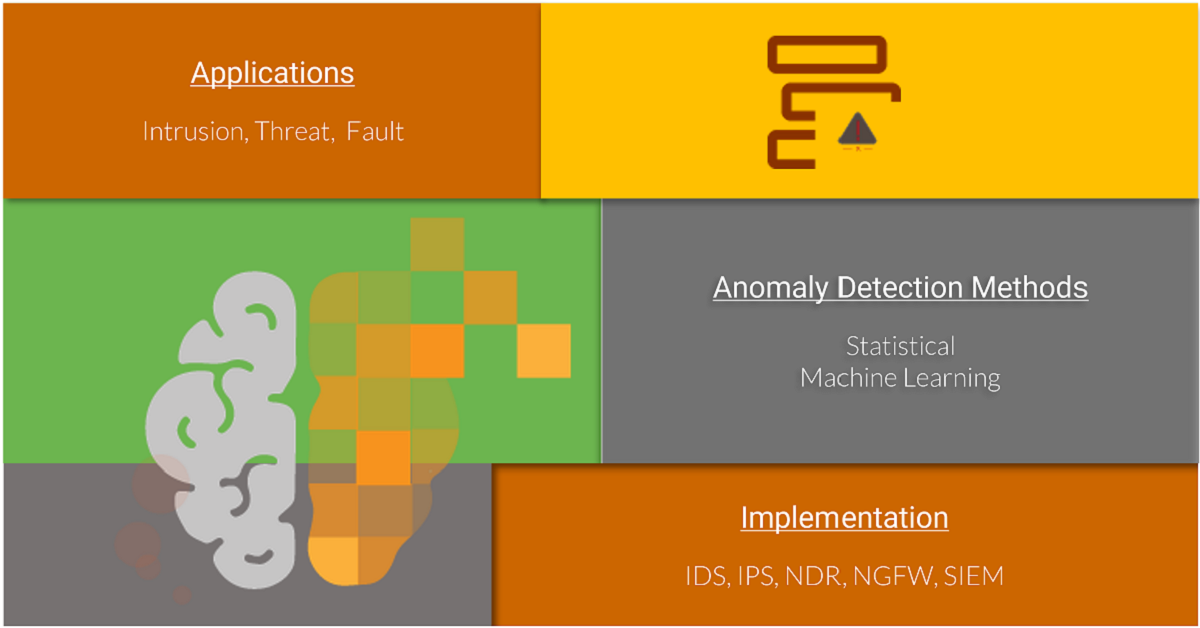
Anomaly Detection Methods
Anomaly detection methods implemented in various networking and security products can be categorized broadly as Statistics based and Machine Learning based.
Statistics based
Statistical methods fit a model of normal behavior to the data and then apply statistical inference tests to determine if the new data belongs to this model.
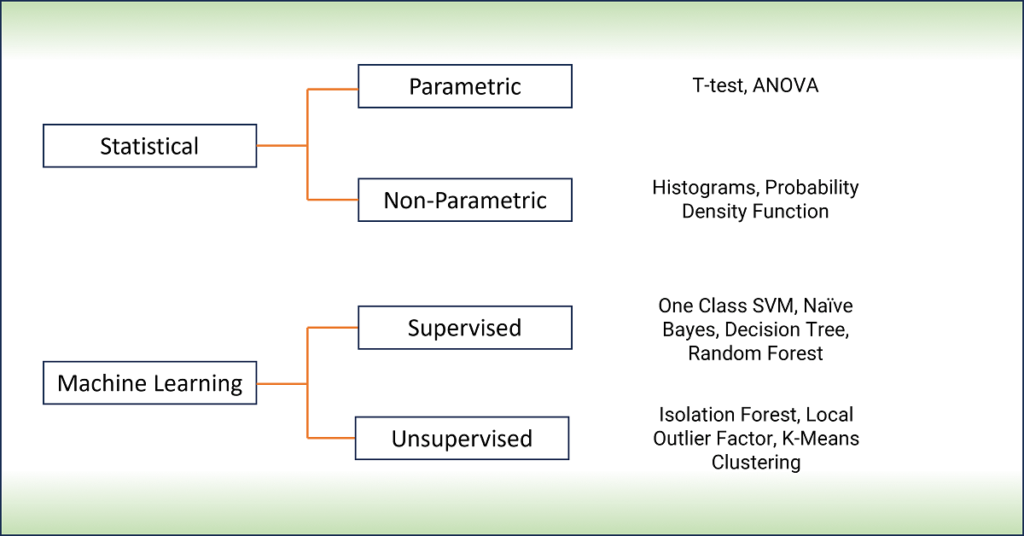
There are two types of statistical approaches: Parametric and Non-Parametric.
parametric
To make predictions using a parametric model, all you need to know is the model’s parameters which are mean(μ) and standard deviation(σ) for a normal distribution. T-test and ANOVA are two commonly used methods. Since network traffic rarely follows a normal distribution, parametric models have limited use in network anomaly detection and generate a lot of false positives.
Non-Parametric
A non-parametric technique does not assume knowledge of the underlying distribution. The commonly used non-parametric methods are histogram and probability density function.
Machine learning based
Machine Learning based models learn the patterns in data during training of the model and then can classify or predict using new data.
There are two commonly used Machine Learning approaches: Supervised and Unsupervised.
Supervised
Supervised Machine Learning algorithms are used to classify data instances as normal and anomalous. Classification models must be able to handle imbalanced class distributions as normal instances are more common than anomalous instances. The class labels should be available for both normal data and anomalies.
The commonly used supervised Machine Learning algorithms in classification of network anomalies are:
- One class Support Vector Machines
- Naïve Bayes
- Decision Tree/ Random Forest
Unsupervised
Unsupervised Machine Learning algorithms do not depend on the availability of data with normal and anomalous labels. Instead, they analyze the inherent structure of the data to identify patterns and deviations that may indicate anomalies. The basic assumption is that anomalies represent a very small fraction of the total data.
The commonly used unsupervised Machine Learning algorithms in detection of network anomalies are:
- Isolation Forest
- Local Outlier Factor (LOF)
- K-Means clustering
All the above unsupervised algorithms use the concept of distance between data points to identify anomalies. Isolation Forest and LOF use distance metrics to measure how different a data point is from the rest of the data, while K-Means clustering use distance metrics to group network data into several clusters.
How does this work with network traffic data?
A baseline normal traffic profile is determined from the network traffic data, and any data instances that deviate from the normal baseline profile are categorized as “anomalous”.
The network traffic depending on the granularity at which it is collected (Flow, packet, SNMP metrics or other telemetry data) will contain certain descriptors. For example, a packet sent from a source to a destination can include timestamp, source and destination IP address, length of the packet etc. A combination of these descriptors is input as “features” to the Machine Learning algorithms.
The traffic descriptors are typically used in three ways to define normal and detect network anomalies.
Creating a normal threshold for a single metric (e.g., Round Trip Time).
Anything that deviates from the threshold could be anomalous. Unlike in a rule-based system where a threshold is pre-configured, Machine Learning algorithms learn the normal threshold values.
Creating a normal profile for a pattern of data
A normal TCP handshake has a SYN-SYN-ACK-ACK pattern. Several SYN packets with small packet sizes, is a pattern that deviates from a normal handshake and can be marked as anomalous (potential port scan).
Creating a normal traffic behavior profile
Analyzing network behavior over a period can help establish a pattern of behavior and identify deviations from normal. These behavior profiles detect changes in network traffic volume (changes in bytes/sec or packets/sec over time) or detect changes in distributions of traffic features e.g., traffic distribution by source/destination IP address, source/destination ports, packet size etc. For e.g., baseline traffic volume can be established for specific source or destination IP addresses over specific time periods and any deviation could be anomalous (e.g., potential DDoS attack).
Just as a network engineer has different workflows and data to triage different alerts, there is no general anomaly detection model for the whole network.
The determination of normal and anomalous varies by the Machine Learning method (supervised or unsupervised) and the specific algorithm used (clustering vs isolation forest). Because of that it is important to define granular models and combine multiple algorithms to achieve the desired result.
Challenges with Anomaly Detection
Even with using multiple methods and granular models, solving the network anomaly detection problem has several challenges. This is due to changing network behaviors and emerging and evolving threats and attacks.
So, what are some of these challenges?
- Defining what is normal and what is an anomaly is often imprecise and this definition can change depending on various factors.
- Finding the right balance between detecting anomalies accurately and minimizing false positives.
- Distinguishing between noise and anomaly. Noise in network data could be errors in measurement of network traffic or background noise (software downloads, web crawlers)
- Providing explanation as to why something was marked as an anomaly.
Where is Network Anomaly detection implemented?
Anomaly detection as it pertains to networking and security is primarily used in the following applications.
Intrusion and threat detection
While signature-based detection compares behavior to rules and is suitable for identifying known threats, anomaly-based detection compares behavior to normal profiles and can detect unknown threats.
Fault detection
Fault detection is another application for anomaly detection. While not all anomalies are faults, all faults are anomalies in some form, so fault detection systems might implement anomaly detection with additional functionality to identify faults.
Anomaly based detection methods are most commonly implemented in the following platforms:
- Intrusion Detection Systems (IDS)
- Intrusion Prevention Systems (IPS)
- Next Generation Firewall (NGFW)
- Network Response and Detection (NDR) systems
- Security Information and Event Management (SIEM)
- Network Monitoring and Observability systems (for fault detection)
However, the implementation of anomaly detection functionality varies widely depending on the vendor platform and product. Some require specifying behavior profiles manually, some are purely statistics based, some are Machine Learning based, and some might have a combination of approaches.
To summarize, Network anomaly detection systems can find deviations from normal, which can narrow the scope when diagnosing a problem. It can automatically generate threshold values based on a baseline. While it can aid in troubleshooting, it cannot provide diagnosis or root cause analysis . Network engineers would still have to determine if it is a valid anomaly and troubleshoot to find the root cause of the anomaly.