Networks are dynamic, where the hardware, software, network traffic patterns and user behavior change over time.
Network baselining involves taking measurements of the network’s behavior at different times. These measurements are for a set of metrics that define the normal working conditions of the network. A metric can be used quantitatively or qualitatively to understand network behavior.
In the past baselines involved taking averages of a certain metric over a time period. As networks and cyber-attacks became more complex, other statistical approaches were used (standard deviation, percentiles etc.)
Anomaly detection has renewed the focus on having more accurate and dynamic baselines. Understanding the network normal in finer granularity than what statistical approaches provide is important to avoid large number of false positives. Machine Learning can find patterns and relationships between multiple metrics to provide dynamic baselines.
In this blogpost, we will talk about the benefits of having accurate baselines, metrics used, systematic approach to baselining the network and how complex networks can use Machine Learning to create dynamic baselines.
Benefits of network baselines
Network baseline provides several benefits for understanding network behavior and identifying network faults, cyber threats and attacks.
A well-defined network baseline can be used to:
- Understand the use of network resources to forecast future capacity requirements.
- Determine the effect of a network change – to get the before and after picture.
- Establish dynamic thresholds for intelligent alerting. Operations teams must maintain a large number of devices and applications, so manually setting thresholds can be inaccurate and time-consuming.
- Detect anomalies with minimum false positives.
- Detect sophisticated cyber-attacks using dynamic behavior baselines.
- Identify accurate service level agreements (Quality of Service (QoS) that can be expected for a particular application)
- Optimize network performance.
How do you create network baselines?
There is no standardized framework that defines what metrics to use, what types of data to collect, how long to collect the data and how often to revise the baselines.
- Different organizations use their own methods and data to create network baselines, if they create one at all.
- Different network monitoring and observability systems use their own set of metrics and criteria to determine baselines.
In the absence of a well-defined methodology and process, it is useful to follow a systematic approach such as this.
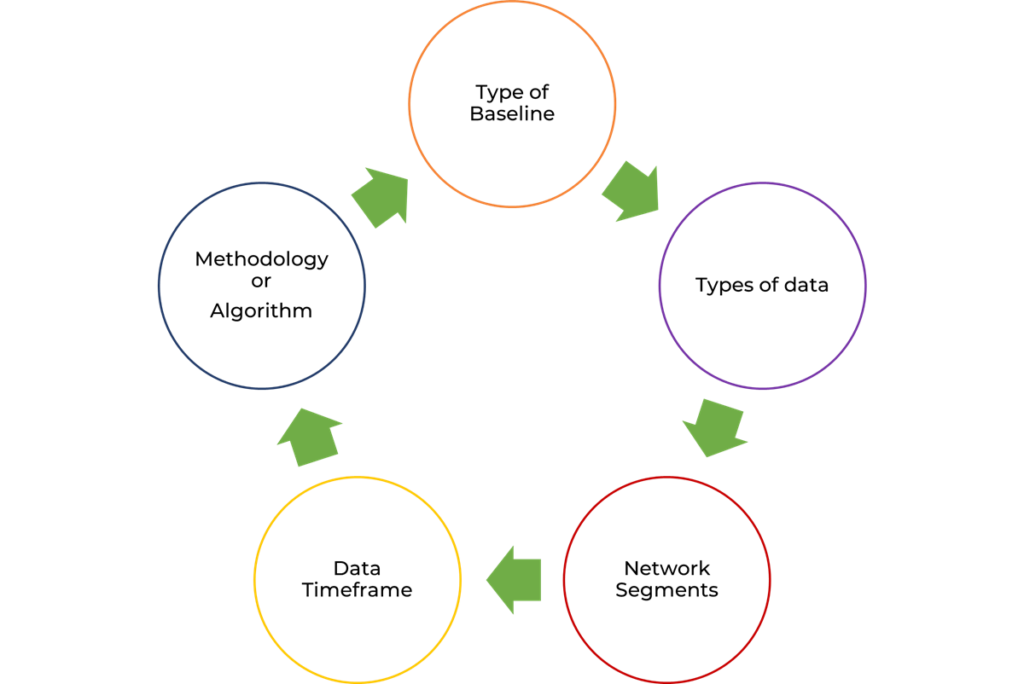
- Define the type of baseline (e.g., traffic utilization, traffic behavior and performance)
- Determine what types of data to collect and tools to use to collect and store the data.
- Identify devices or network segments. Baselining every device and subnet in a large network is not practical.
- Set data collection schedule.
- Determine how long data will be collected to establish a baseline. Recommendation is 21-30 days to account for different network usage patterns.
- Determine how frequently to collect data (anywhere from 30 seconds to 1 hour).
- Determine the time snapshots to create the baseline.
- Average values over the entire baseline data collection period are useless. You will need baselines for min, max and average traffic usage using daily, weekday/weekend or hourly snapshots. This is to account for peak usage hours, different types of traffic (nightly backups, updates, user traffic) and seasonal variations.
- Determine what methodology or algorithm to use for creating the baseline.
What metrics should you use for the baseline?
In the absence of standardized framework, there are a few broad categories of network metrics used to create baselines. Each category is useful to determine a different aspect of network behavior.
Device metrics (e.g., CPU, memory, and disk usage) – To baseline device utilization. This could be routers, switches, firewalls and servers.
Traffic utilization metrics – To baseline the traffic being forwarded through the network.
- Total input and output packets and bytes
- Per protocol packets and bytes (TCP, UDP, ICMP etc.)
- Per application packets and bytes (HTTP requests, FTP file transfers)
Network performance metrics – To baseline Quality of Service (QoS).
- Throughput
- Packet loss (Mean packet loss over a time period)
- Delay (RTT values for different protocols (DNS, TCP)
- Delay variation
Network behavior metrics – To baseline network activity and used to detect cyber threats, attacks, or intrusions.
- Activity from multiple entities (users, hosts, links) that share similar characteristics. For example, hosts that communicate with a particular server.
- Activity of an entity (users, hosts, links) for different time periods. For example, traffic usage of a host at different times of day.
How do you calculate baselines?
Baselines can be calculated in many ways, from performing statistical analysis of the collected metrics to using Machine Learning models.
The statistical methods can use all the samples in the historical data or a sliding window (newer data samples have more influence) to calculate thresholds.
If the data has significant outliers, it might be useful to make adjustment for outlier values by discarding (say 2%) of the most extreme values.
Statistical approaches
Averages, Min and Max
A starting point for calculating baseline is to use simple statistics such as min, max and average value. For example, number of bytes transmitted per interface or flow can be averaged hourly. Calculating min and max values will give an idea of the peak and low traffic during the hour. A simple network monitoring system can give summary statistics for a metric over a period of time.
Baseline Range
A baseline that just takes average, min and max values is not very accurate as it will not account for large variations. Using average and number of standard deviations (above and below) from the average values can be used to compute the range of normal values. While this is an improvement from using just averages, it can still result in large false positives.
Baseline with trend and seasonality
Using averages and standard deviation doesn’t account for seasonal variations and trend. Seasonality is the periodic traffic pattern that varies by day of the week, hour of the day, and minute of the hour. Trend is a steady movement of the traffic in a particular direction (increase or decrease). For example, adding additional bandwidth on a link might cause traffic to steadily increase.
Exponential smoothing algorithms can be used to predict current and future baseline values of different metrics, while considering seasonality and trend.
Histograms, Probability Density Function and Percentiles
An average would work only if all the values of the metric are roughly the same (e.g., Round Trip Time is close to 2ms all the time) and follow normal distribution. Network traffic typically exhibits long-tail distribution
Histograms, density function and percentiles all allow us to understand the distribution.
In a histogram, you assign the metric value to pre-defined buckets. Each value increases the count for the bucket.
A density plot is like a histogram, except a density function is used to fit the distribution of values for a given metric and a smooth line is used to summarize this distribution.
A percentile is the value of a metric below which a certain percent of values fall. For example, the 95th percentile is the value below which 95 percent of the values for the metric are found. Some of the metrics where this is useful are Server Response Time, Retransmission delay and Round Trip Time.
Machine Learning algorithms
What does Machine Learning provide over statistical approaches?
Machine Learning lets you use multiple metrics to create more complex network baselines and can understand the relationship between these metrics. Both unsupervised and supervised algorithms can be used to create baselines.
Clustering algorithms are one of the commonly used unsupervised algorithms. They exploit the underlying structure of the data distribution and define rules for grouping the data with similar characteristics. This grouping can then be used for detecting outliers.
- In K-means clustering, the variable “k” is a user defined parameter that establishes the number of centroids. The centroid is a variable representing the center (or mean) of a cluster of data. K-means clustering can work with both traffic metrics (e.g., number of bytes) or patterns of behavior associated with entities and group entities with similar behaviors together.
- Another clustering algorithm that can be used is DBSCAN. This is distinct from K-Means in that it clusters results based on local density, identifies outliers as noises and uncovers a variable number of clusters, whereas K-Means finds a precise number of clusters.
Instead of just using historical data to create baselines, supervised learning algorithms can predict values of certain metrics or predict behaviors based on historical data. This can be used to fine tune threshold values or behaviors for intelligent alerting and anomaly detection.
- A simple supervised algorithm that can be used to model network baseline is Linear-Regression. It can model the relationship between a dependent variable e.g., Round Trip Time – and one or more independent variables (e.g., transmitted bytes, link speed, retransmissions).
In this blogpost, we talked about the importance of network baselines and how statistical and Machine Learning algorithms can be used to create dynamic and accurate baselines.
Stay tuned for future posts, where we will do deep dives into different metrics and Machine Learning algorithms that can be used create network baselines.